Understanding and fixing an issue in AI-generated print PDFs
Opens in new tabSpot the difference: Turning visual differences into PDF workflow automation
Page size, artwork position or ink coverage can help explain why two PDFs need different treatment. Learn how pdfToolbox can measure those differences and use them to guide an automated workflow.
When PDFs arrive in production, we can often spot the difference between them and immediately understand what needs to happen next. This file belongs to one product. That file belongs to another. One needs a particular imposition, while another needs different handling. An operator may reach that decision in seconds. An automated workflow needs something more: a measurable reason to reach the same conclusion.
A good place to start is with a simple question:
What makes these PDFs different?
Imagine several different products entering the same workflow. One might have a different page size from another. If those dimensions consistently identify the product, we already have something useful. Page size is measurable, so it can help determine what happens to the PDF. But production files aren’t always that cooperative. What if two PDFs have exactly the same dimensions but still need different treatment? Page size has taken us as far as it can. We need another clue. Perhaps the difference is in the artwork itself.
Let’s take a deliberately simple example.
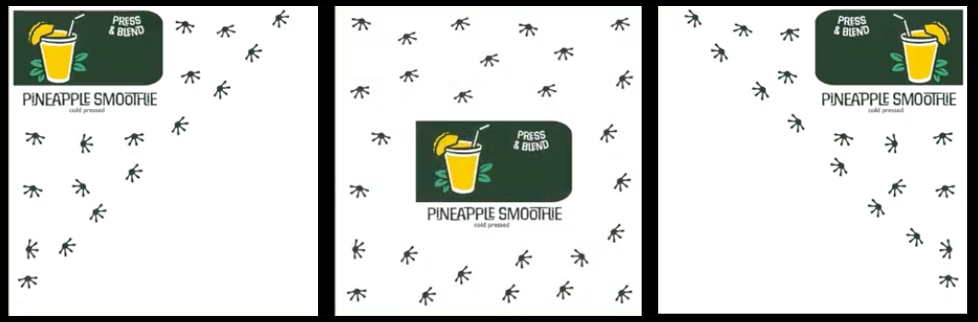
We have three square PDFs with identical page dimensions. In one, the artwork appears mainly in the upper-left portion of the page. In another, it appears in the upper-right. The third contains artwork across the entire page. Put them next to each other, and we can easily tell them apart. How can we help an automated workflow do the same? We don’t necessarily need it to understand the artwork. We just need to find a difference it can measure. In this case, that difference is where the artwork appears on the page. Rather than analysing everything, we can focus on specific areas where we know the files differ.
This is where Effective Ink Coverage in pdfToolbox becomes useful. Measuring Effective Ink Coverage within a defined area tells us how much ink is present in that part of the page. Higher coverage means more ink. Lower coverage means less. A difference that is obvious to a person now becomes information an automated workflow can evaluate. In our example, inspecting areas on either side of the page could distinguish the three artwork types. Once we can tell them apart, we can start making decisions.
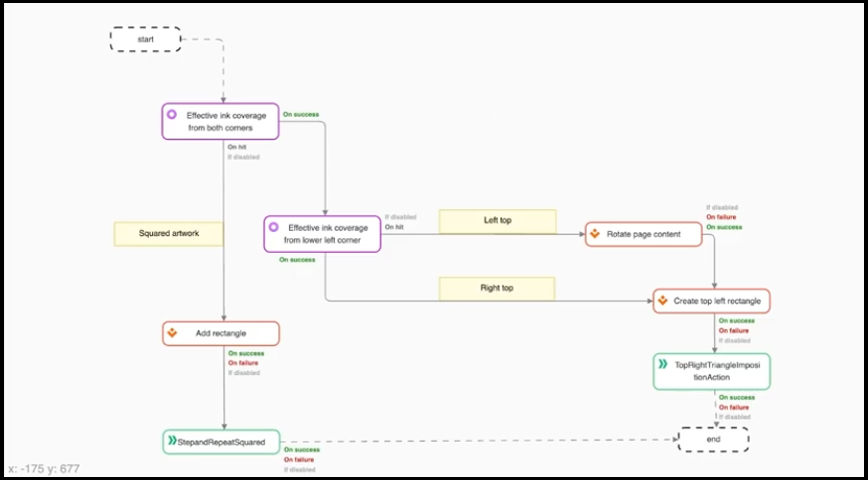
Knowing what has arrived is useful. The real value comes from what we do with that information. Perhaps one artwork type needs one imposition template, while another requires a different one. Once the workflow identifies the incoming file, it can automatically select the appropriate production path. A Process Plan brings those individual pieces together. The Checks provide information about the PDF. The Process Plan uses that information to decide which path the file should follow and what happens next. That changes the purpose of the Check. We’re no longer checking a PDF just to learn something about it. We’re checking because the result helps us make a production decision.
Simple shapes make the idea easy to see. Identifying a triangle on the left or right isn’t particularly interesting on its own. The same approach, however, has much broader uses. Different page sizes might identify different products. Artwork in a particular area might distinguish one variation from another. Elsewhere, another measurable characteristic of the PDF could provide the information we need.
So the question doesn’t have to be:
“How do I identify this particular type of artwork?”
A more useful question is:
“What is reliably different about the files I receive, and can I measure that difference?”
That question applies to many production scenarios, well beyond our three simple shapes.

When building an automated workflow, it’s tempting to jump straight into creating Checks, Fixups and Process Plans. Sometimes, the best starting point is simpler. Take a few representative files. Put them next to each other. Look at them. What changes from one to another? Is it the page size? The position of the artwork? The amount of ink in a certain area? Or does another characteristic consistently separate one type from the next?
Once you find that difference, consider how pdfToolbox can measure it. Then work out how that measurement can drive the workflow. That’s the broader idea behind our Effective Ink Coverage example. The simple artwork makes the concept easy to understand. The real opportunity is to use characteristics of incoming PDFs to make automated production decisions.
What comes in? What makes it different? Can we measure it? And if we can, what can we automate because of it?
Those four questions can be a surprisingly powerful place to start.